Grafana Dashboards
Klio ships a Grafana dashboard template that visualizes the metrics it
exposes. The dashboard is generated from code with the
Grafana Foundation SDK
and committed to the repository at
observability/grafana/klio-dashboard.json.
The dashboard queries the Prometheus export of Klio's OpenTelemetry metrics, so it complements the OpenTelemetry setup rather than replacing it.
What the dashboard shows
The dashboard is a single dashboard split into row sections:
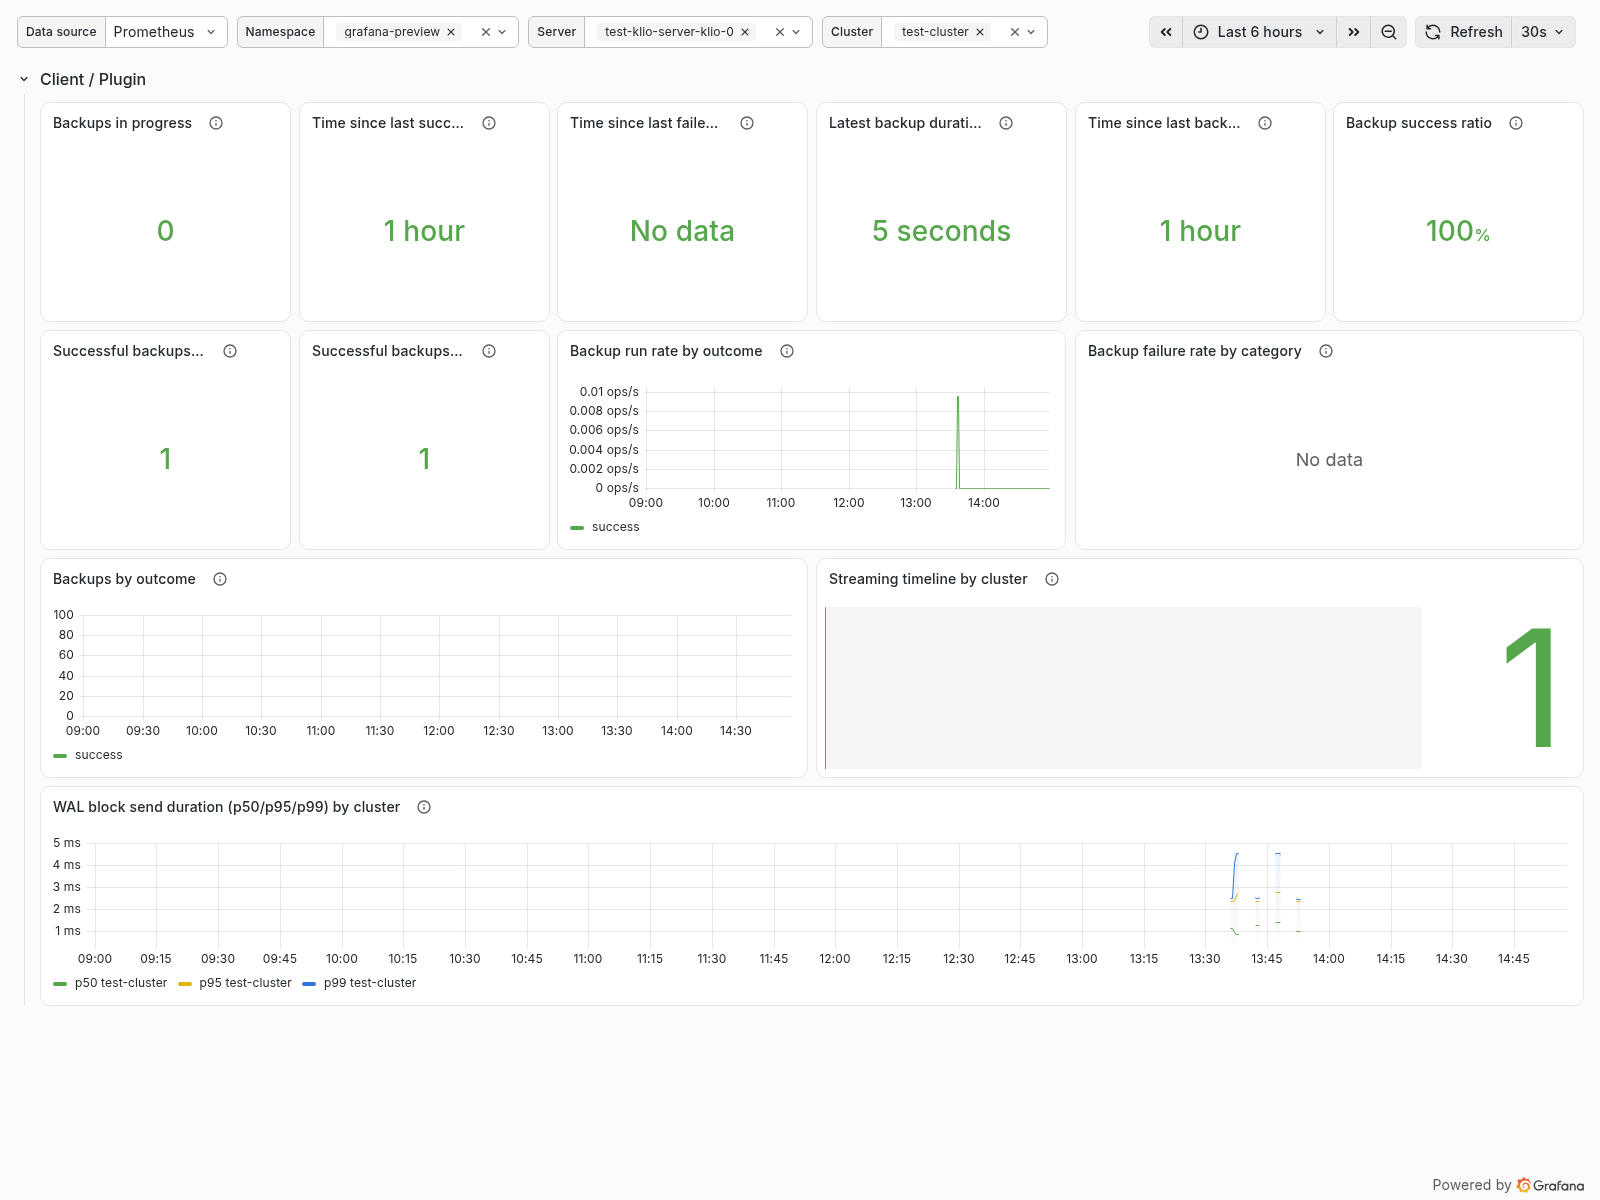
- Client / Plugin — the backup lifecycle as seen by the plugin sidecar running in each PostgreSQL pod: backups in progress, time since the last backup started, succeeded and failed, the latest backup duration, the p50/p95/p99 backup duration distribution, backup run and failure rates, and the backup success ratio. Also the WAL streaming client the sidecar supervises as a child process: the PostgreSQL timeline it is currently streaming and the p50/p95/p99 latency of sending a WAL block to the server.
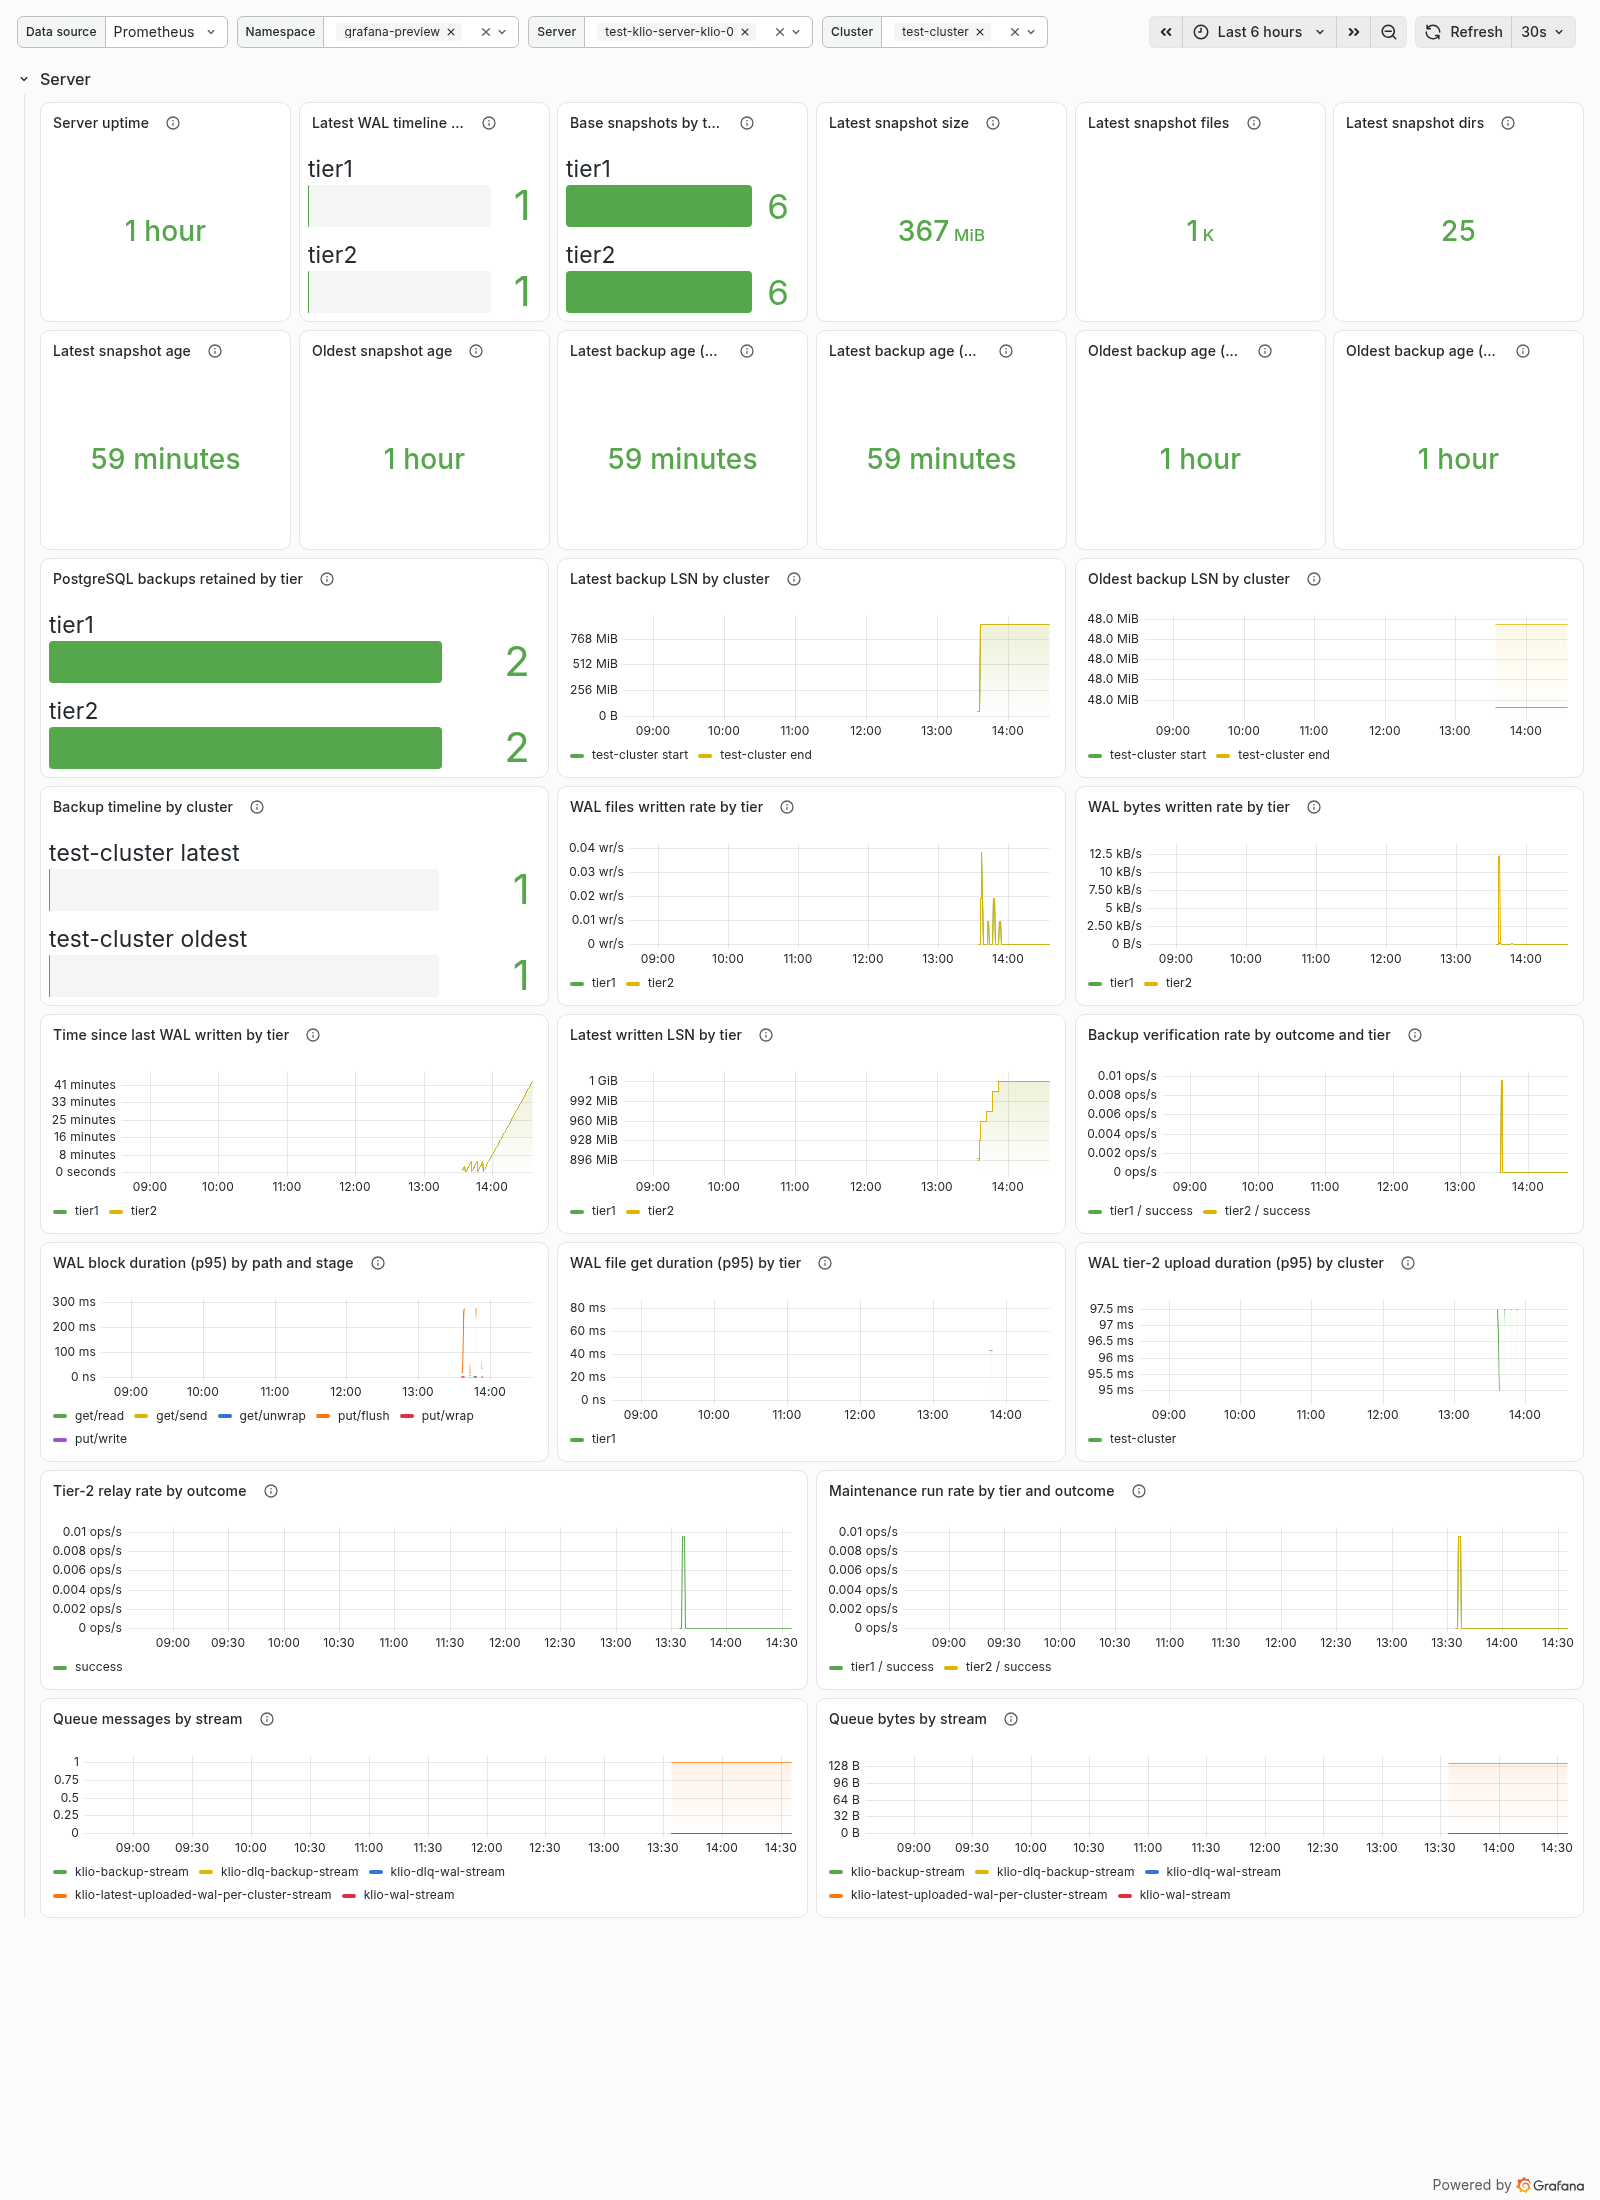
- Server — the state of the Klio server StatefulSet: uptime, WAL ingest throughput and freshness per tier, the latest written LSN, backup verification outcomes, the base snapshot inventory (including file and directory counts), p50/p95/p99 WAL block/get/upload duration by path, stage and tier, tier-2 relay and maintenance run rates, the retention window of the physical PostgreSQL backups (counts by tier, latest/oldest backup age, start/end LSN and PostgreSQL timeline per cluster), and the embedded NATS JetStream queue.
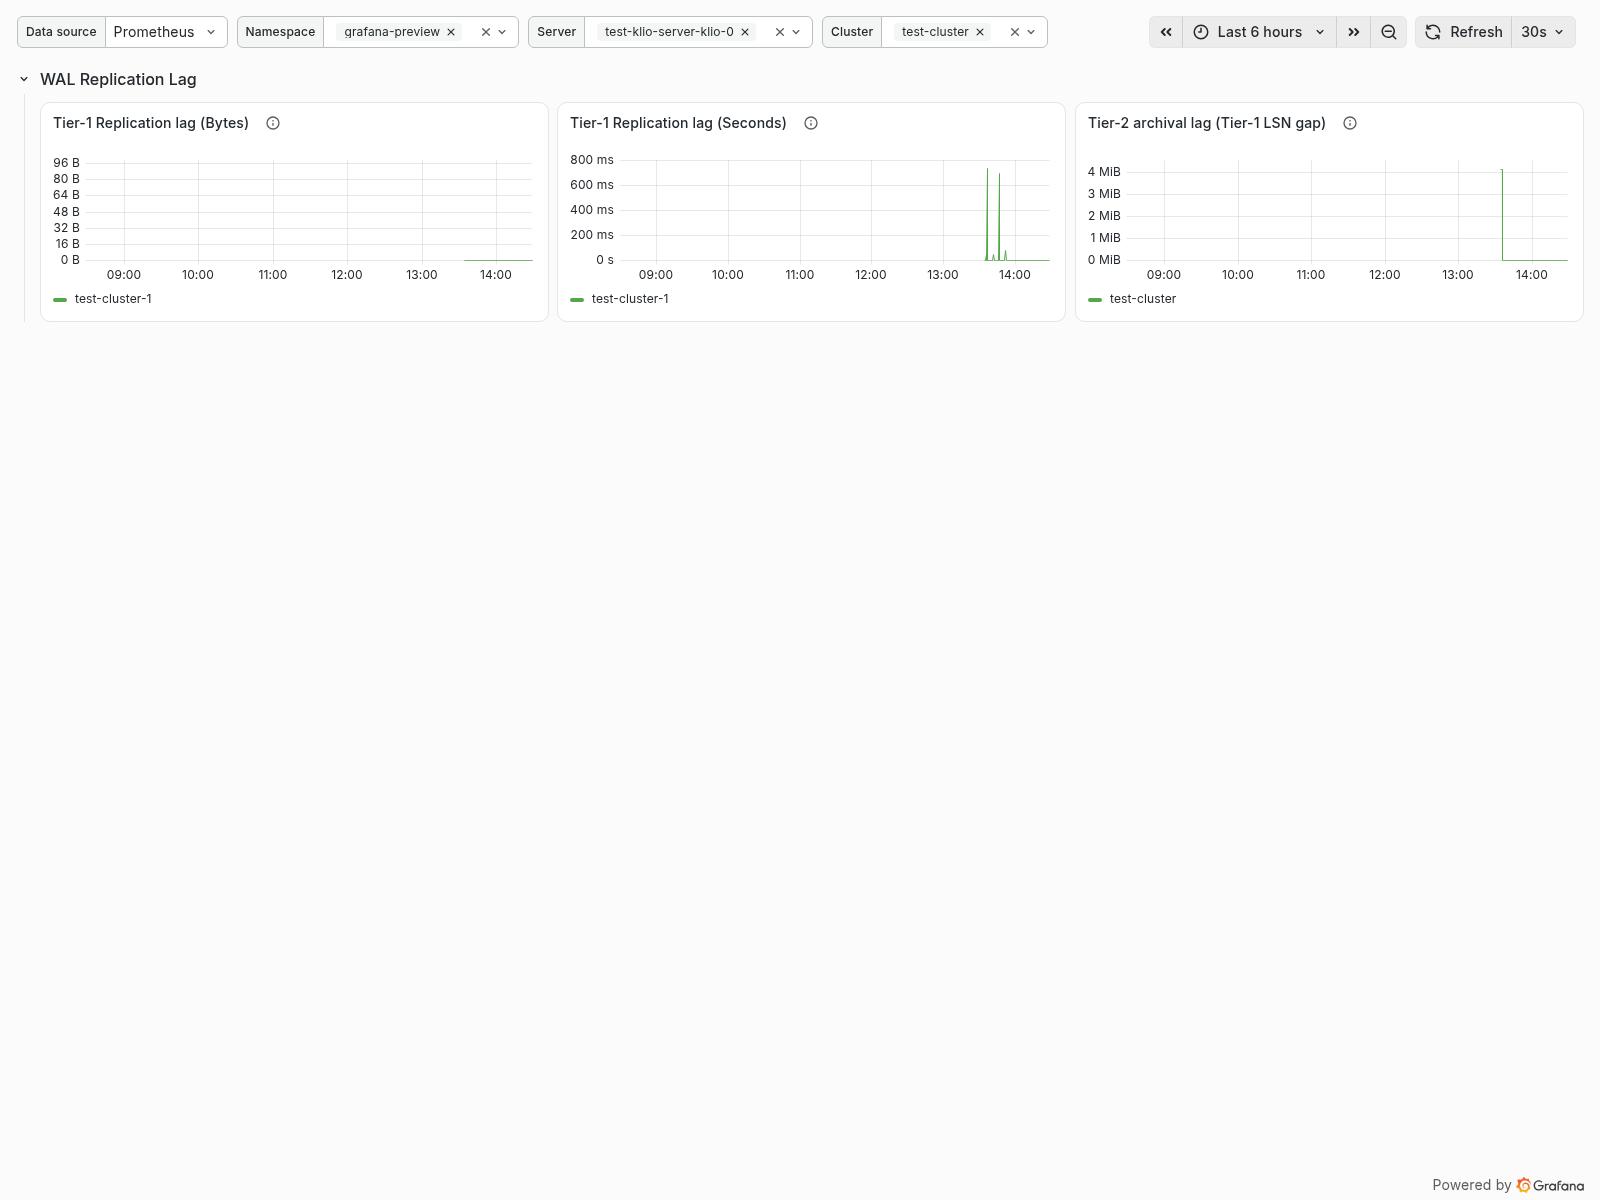
- WAL Replication Lag — how far Klio's WAL streaming client trails the
PostgreSQL primary, using CloudNativePG's replication metrics: the replay
lag in bytes and the flush lag in seconds. These panels read the
cnpg_pg_stat_replication_*metrics, so they require CloudNativePG monitoring to be scraped into the same Prometheus (see the prerequisites below).
Some panels need extra context to interpret correctly. Two are derived from the alerting guidance in OpenTelemetry:
- Time since last WAL written by tier surfaces the staleness signal described under Alerting on stalled WAL processing: a stale tier-1 value means PostgreSQL is no longer shipping WALs, while a stale tier-2 value means the remote backend is no longer receiving them.
- Tier-2 archival backlog (LSN gap) plots the LSN difference between tier 1 (local disk) and tier 2 (remote storage). Read together with the staleness panel, it tells a slow pipeline (timestamps advancing, gap growing) apart from a stalled one (timestamps and LSN both frozen).
Two more are a statistical caveat rather than an alerting signal. Both are histogram percentiles that need enough recent samples to be reliable:
- WAL block send duration (p50/p95/p99) by cluster is most meaningful
under active write load. On an idle or low-write cluster, WAL blocks are
sent too infrequently for the underlying
histogram_quantileto produce a reliable percentile, so the line can look sparse or noisy rather than simply absent. - Backup duration (p50/p95/p99) has the same limitation, more acutely: backups are infrequent, so this panel is computed over the whole selected range (rather than a short rate window) to stay populated between runs. Widen the dashboard range to span several backups for a stable reading; if the selected range contains no backup, the panel is empty. Use it to spot backup runtime trending up over time rather than to read an instantaneous value.
Prerequisites
The dashboard reads the Prometheus names of Klio's metrics (for example
klio_plugin_backup_runs_total and klio_server_wal_written_total). You
therefore need Prometheus scraping those metrics. Any of the export paths
described in OpenTelemetry works:
- An OpenTelemetry Collector with a Prometheus exporter that Prometheus scrapes.
- The Klio Prometheus exporter (
OTEL_METRICS_EXPORTER=prometheus), scraped directly.
The WAL Replication Lag row additionally reads CloudNativePG's
cnpg_pg_stat_replication_* metrics. To populate it, scrape the
CloudNativePG cluster monitoring (its PodMonitor) into the same
Prometheus. The rest of the dashboard works without it.
When you route metrics through an OpenTelemetry Collector, enable
resource_to_telemetry_conversion on the Prometheus exporter so that
resource attributes such as the pod and namespace become Prometheus labels.
The sample collector under
operator/config/samples/opentelemetry/otel_collector.yaml already does
this.
Importing the dashboard
- In Grafana, go to Dashboards → New → Import.
- Upload
observability/grafana/klio-dashboard.jsonor paste its contents. - When prompted, select your Prometheus data source for the
datasourcevariable.
The dashboard declares a datasource template variable, so it is portable
across Grafana installations and is not tied to a specific data source UID.
The namespace and cluster template variables at the top filter the panels
by Kubernetes namespace and PostgreSQL cluster.
Example: kube-prometheus-stack
This example follows the same flow as the CloudNativePG quickstart, using the kube-prometheus-stack chart. Adapt it to your own Prometheus/Grafana if you run a different setup — only the metric prerequisites described above are required.
Install Prometheus and Grafana:
helm repo add prometheus-community \
  https://prometheus-community.github.io/helm-charts
helm upgrade --install \
  -f https://raw.githubusercontent.com/cloudnative-pg/cloudnative-pg/main/docs/src/samples/monitoring/kube-stack-config.yaml \
  prometheus-community prometheus-community/kube-prometheus-stack
Ensure Prometheus scrapes Klio's metrics by deploying a ServiceMonitor (or a
PodMonitor, if the collector's Service has no labels) for the
OpenTelemetry collector's Prometheus exporter — see
operator/config/samples/opentelemetry/otel_collector_svc_monitor.yaml.
Port-forward Grafana and log in with admin / prom-operator:
kubectl port-forward svc/prometheus-community-grafana 3000:80
Open http://localhost:3000/ and import
observability/grafana/klio-dashboard.json via Dashboards → New → Import,
selecting your Prometheus data source.
Alternatively, load it automatically through the Grafana dashboard sidecar
with a labeled ConfigMap:
kubectl create configmap klio-grafana-dashboard \
  --from-file=klio-dashboard.json=observability/grafana/klio-dashboard.json
kubectl label configmap klio-grafana-dashboard grafana_dashboard=1
Regenerating the dashboard
The committed JSON is generated from the Go program under
observability/grafana/. To regenerate it after changing the generator (or
after a grafana-foundation-sdk bump), run from the repository root:
task grafana:gen
CI runs task grafana:uncommitted, which regenerates the dashboard and
fails if the committed JSON has drifted from the generator output. Commit
the regenerated file whenever it changes.